
When it comes to marketing, there are a lot of data to track, especially when you implement digital marketing. As technology improves, there are smarter ways and more various ways to approach our audience, hence more ways to track and analyze our marketing efforts. If we take a look at Google Ads and Meta Ads’s metrics alone, there are I believe more than a hundred metrics, but there are only a few that are essentials.
Before going to the examples, we need to identify what metrics we want to see and why, this can help us to build a goal mindset so that the dashboard can follow. First of all, there are a few ways to see metrics, for example, we can compare month to month, week to week, or quarter to quarter. There are also metrics we see only per campaign and the success definition can be compared to previous campaign or compared to the usual days. While for ads performance, we can see cost per result as the main metrics, while also considering market situation, seasons, strategy, visual, etc. Below, I will break down some of the common marketing metrics:
Digital Marketing Metrics
Digital Ads
- Impression
- Reach
- Click
- Leads
- Install
- Sales
- Video Watch Time
Web
- Web traffic
- Click-Through Rate (CTR)
- Bounce Rate
Social
- Impression
- Reach
- Engagement (Like, Comment, Share)
- Engagement Rate
Examples of Marketing Dashboard
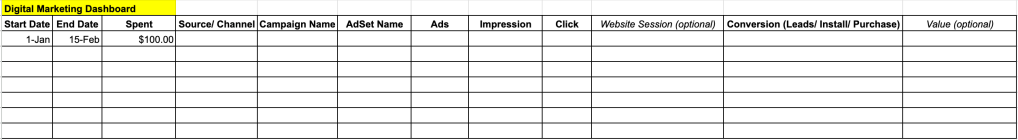
Examples of Business Dashboard
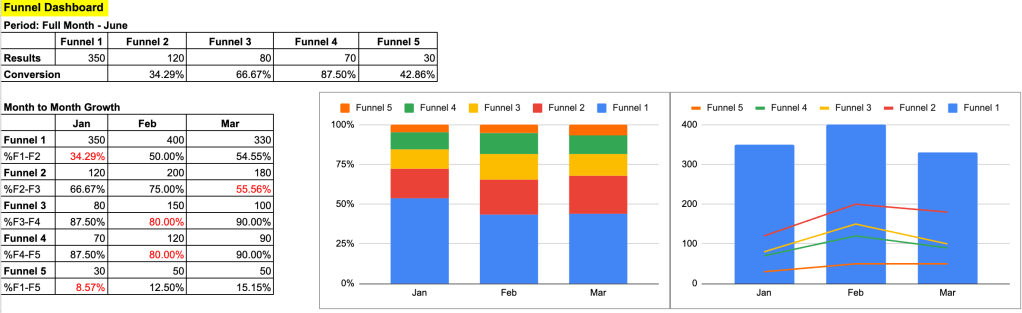
For many marketing leaders, they usually need a more helicopter view to see business impact from overall marketing efforts, such as budget against results or usually metrics being used is ROI, drop off stage within the funnel, more effective channel, etc. To have this, every industry might need different funnels and tables, but let me share the high level where you can adjust as needed.
For B2C and B2B industries that has ‘Leads’ as the top or medium funnel (Leads, First Attempt, Second Attempt, Conversion)
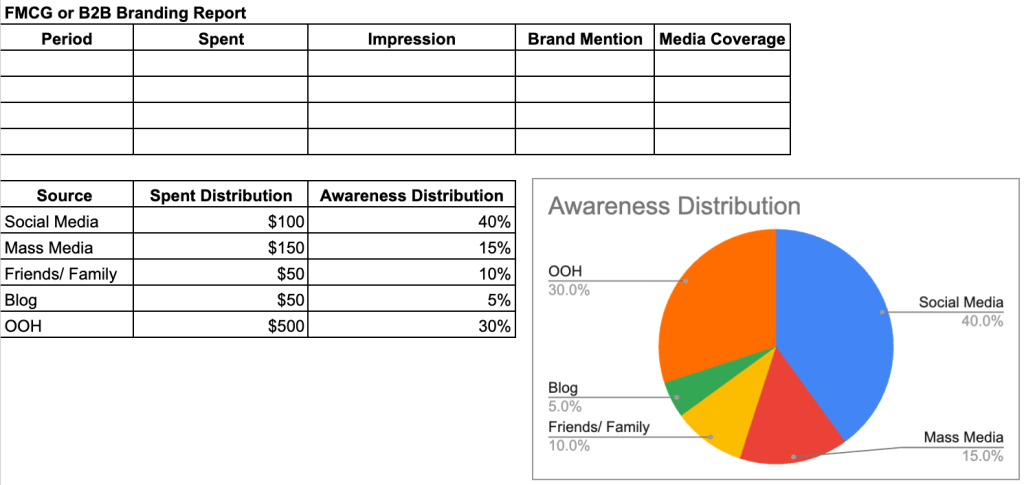
For B2C in retail that sells products direct to customers, from stores or online stores or e-commerce (awareness, consideration, purchase, retention)
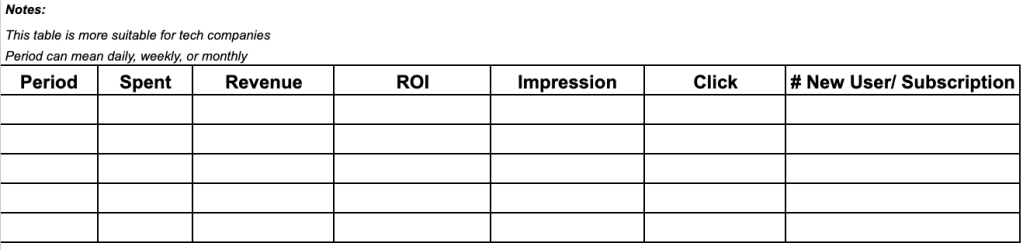
Businesses with subscription model usually uses traffic, register/ free trial, pay, retention. With this model, it is important to keep updated with Churn Rate (how many people -compared to total people who started subscribing- stop subscribing during that period).
There are plenty of different formats we can play around, depending on industry, information that we want to know, as well as the team dynamic within the organization.
For more detail examples of dashboard, please fill in this form. I will send the access link for different formats of reports and dashboards.


Leave a comment